
I’ve stumbled upon an error a few weeks ago when working with a …
Do you want to learn Databricks and do you want to read only one book …
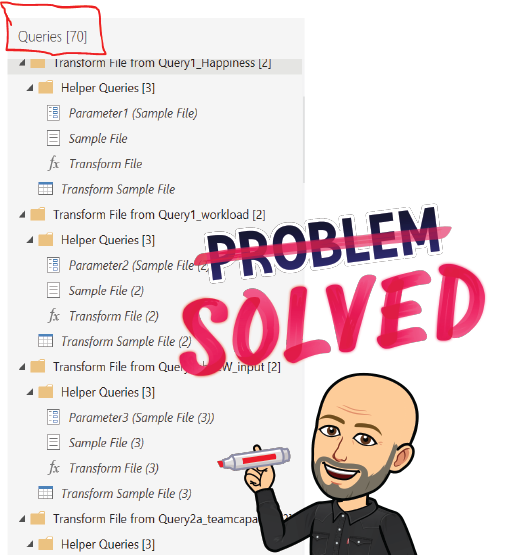
I recently wrote about an approach to dynamically load CSV files to …

Wow, time goes by! Welcome back to the last and final installment of …
Hello and welcome back to the 22th week of the SQL Server Performance …
Hello and welcome back to the last and final month of the SQL Server …
Hello and welcome back to the SQL Server Performance Tuning series. …
Hello and welcome back to the SQL Server Performance Tuning seriesn. …
Hello and welcome back to the SQL Server Performance Tuning series. …
Hello and welcome back to the SQL Server Performance Tuning series. …
Hello and welcome back to the SQL Server Performance Tuning series. In …