

Hello and welcome back to the 22th week of the SQL Server Performance Tuning series. Last week I have talked about baselining in SQL Server, and today I will continue by talking about Wait Statistics and I/O Latency Statistics in SQL Server. When I perform SQL Server Health Checks, I always use these two metrics to get the big picture about the health of SQL Server.
Wait Statistics
Every time you execute a query in SQL Server, the query will wait. At the first look this looks miserably bad, but there is a very good underlying reason why queries are always waiting in SQL Server. Every time a query waits, SQL Server tracks these waiting times through the so-called Wait Statistics. Before we talk about the wait statistics itself, I want to describe why queries are always waiting during their execution. The concept of waiting is mainly based on 2 general principles:
- Asynchronous Resource Waiting
- Cooperative Scheduling
Let’s have a more detailed look at both of those. Every time a query waits for a resource which is currently not available - like a page that is not yet cached in the Buffer Pool, or a lock which can’t be granted because of another incompatible lock - the query enters the so-called Suspended state in SQL Server. The query waits in the Suspended state until the resource becomes available.
When the resource becomes available, the query moves into the so-called Runnable state, and waits again, until a CPU becomes available. When a CPU is available, the query finally moves into the Running state, and runs until a resource is again not available. When this happens the query moves again into the Suspended state. The following picture shows this query life cycle.
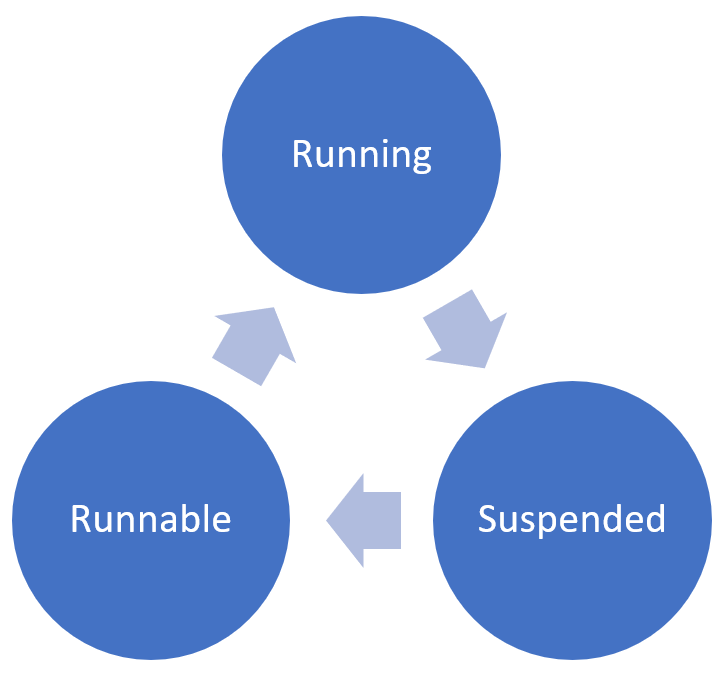
In addition a query will also wait because of the Cooperate Scheduling that SQL Server implements within the SQLOS (SQL Server Operating System). SQL Server schedules its threads itself by using a special functionality of the Win32 API. Cooperative scheduling means that a query moves itself off the CPU, when it has exceeded its quantum of around 4ms. Because of that implementation, queries are always waiting within SQL Server: as soon as a resource isn’t yet available, or as soon as a query has exceeded its quantum - the query moves into the Suspended state and waits.
Every time when a wait condition occurs, the waiting time is tracked automatically by SQL Server through the Wait Statistics. SQL Server reports these wait times through the DMV sys.dm_os_wait_stats. Every row that is returned by this DMV represents one specific wait reason in SQL Server - a so-called Wait Type. By evaluating the wait statistics, SQL Server tells you what the most prominent wait type is. You can afterwards concentrate on that reported wait type and find out what the underlying root cause is, and why the waiting times are so high for that specific wait type.
I/O Latency Statistics
Another very important metric besides the wait statistics are the so-called I/O Latency Statistics that SQL Server also reports. With these latency times it is very easy to find out which files of your SQL Server installation have which latency times. SQL Server reports these metrics through the DMF sys.dm_io_virtual_file_stats. You can pass in a database_id and file_id. If you provide a NULL value for both parameter values, you get back latency statistics for all of your files that are part of the queried SQL Server instance (data & log).
The most important columns from that DMF are io_stall_read_ms and io_stall_write_ms. These are the cumulative latency times since the last restart of SQL Server that have occurred while accessing your storage for read and write operations. If you divide these values by the column num_of_reads and num_of_writes you get the average latency time in milliseconds for disk reads and disk writes from a SQL Server perspective. Very handy for troubleshooting your storage subsystem.
If that DMF reports high latency times, you should not simply run to your storage vendor and buy faster disks. The first step should always be to think why you have high latency times. When I’m working with that DMF at various systems, TempDb almost always reports very high latency times. But this doesn’t mean that you should move TempDb to faster drives, like SSD drives. Think in the first step, why you have high latency times for that specific database. In the case of TempDb you can also try to minimize TempDb usage - e.g. by applying a proper indexing strategy to get rid of explicit sort and hash operators in the execution plan, which spilled over to TempDb.
The Wait Statistics and I/O Latency Statistics are just reporting symptoms to you. Your job is to find the underlying root cause of the performance problem, analyze it, and finally fix it.
Summary

Subscribe to my channel
")
")
Free Microsoft Workshops
![]()
- Fabric Analyst
- Power BI dashboard
- Real-Time Intelligence