

Hello and welcome back to the last and final month of the SQL Server Performance Tuning series. Over the last 5 months we have covered various performance related topics about SQL Server, and we have covered specific performance tuning techniques and problems.
But what are your options, when you have a SQL Server in front of you that doesn’t perform as expected? To help you with that situation, we will cover performance monitoring techniques today, and next week we will have a more detailed look at the so-called Wait Statistics in SQL Server. Let’s start now with performance monitoring.
Let’s establish a Baseline!
A lot of people are sitting in front of their SQL Server’s knowing that it is performing very badly. But they have no idea how to find out the underlying root cause, nor how to resolve it. My answer to that specific problem is very simple: monitor and collect information about the current situation, and compare it against your baseline to identify the most prominent performance bottleneck. Yes, you heard correctly: you need an established baseline to identify performance problems, otherwise it’s just a blind guessing. The following picture shows a very easy approach to identify and solve performance problems in SQL Server based on an established baseline.
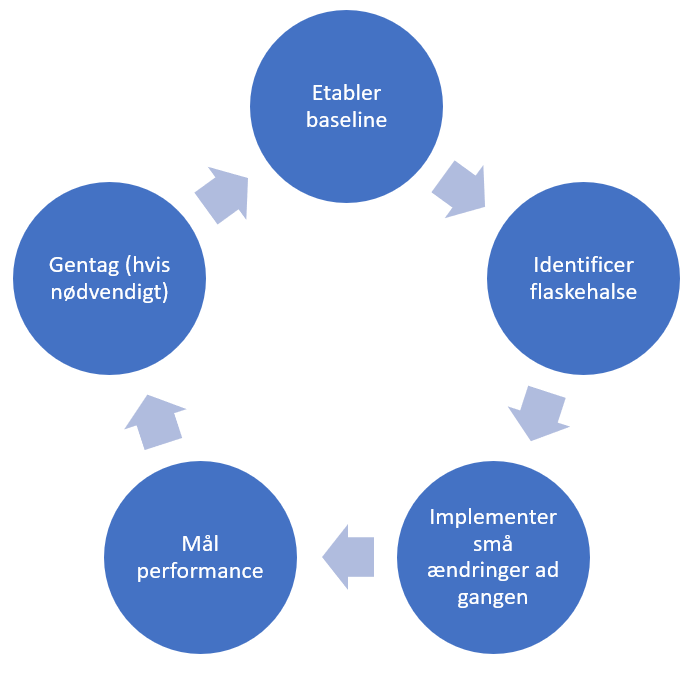
The idea of the approach is very simple. In the first step you have to collect some key metrics about your SQL Server installation. These key metrics serve as your initial baseline. I will talk in the next section which key metrics you should collect. After you have established your baseline, you can start to identify the most common performance problem in the captured data. As you will see in the next section, there are even free tools available with which you can automate this process.
And finally, you make one change at a time to resolve the identified performance problem. You read correctly: you should apply only one change to your SQL Server to resolve the identified performance problem. If you change too many things at the same time, you can’t know for sure, which change resolved your performance problem, and which change may have degraded your performance. That’s a very important point for performance troubleshooting!
After you have applied your change, you can measure your key performance metrics again, and compare it against your established baseline to check if your change was a good or bad one. And the new key performance metrics that you have collected in this step, serve as your new baseline. Easy, isn’t it? The only thing you have to be aware of is to define an exit criteria. You can go through that cycle over and over again in SQL Server. Therefore you have to define when the performance for your installation is “good enough”.
Collecting Key Metrics
When we talk about establishing a baseline, there is always the question, which key metrics should you include? There are so many different performance counters available that are relevant for SQL Server, and SQL Server itself provides you plenty of different DMVs with relevant data about its health. Because I don’t want to overcomplicate things, I only capture a few things in the first step to get a big picture about the health of SQL Server:
- Some specific SQL Server related performance counters
- Wait Statistics
- I/O Latency Statistics
I want to talk now about these relevant performance counters, and next week we will talk in more detail about the Wait and I/O Latency Statistics. Capturing relevant performance counters for SQL Server is a very simple task: you use the Performance Analysis Tools for Logs (PAL) that are provided by Microsoft for free via a download.
The PAL tool provides you a dedicated template for SQL Server, and within the template you can find all the relevant performance counters for SQL Server. That template file can be directly imported into Windows Performance Monitor by setting up a new so-called Data Collection. Therefore you can setup a trace for the relevant performance counters of SQL Server within a minute!
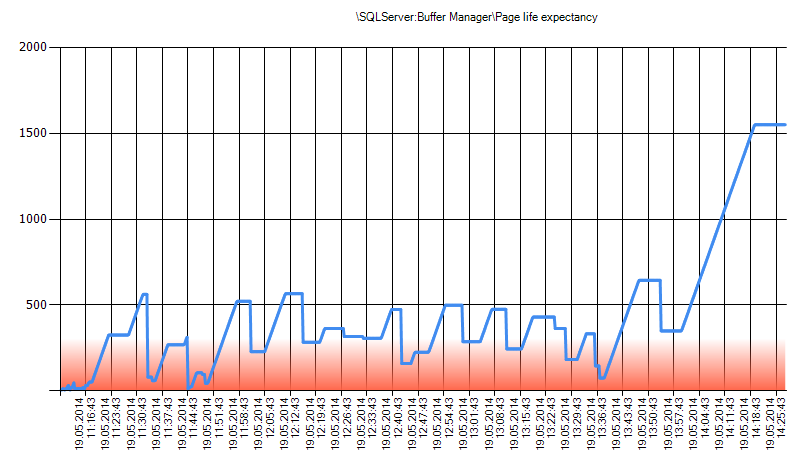
Another nice benefit of the PAL tools is that you can automatically analyze a captured .blg file of Windows Performance Monitor with that tool. As an output you will get a (huge) HTML report that tells you in which areas you have possible performance problems. The following picture shows a simple graphic from this report.
When I perform SQL Server consulting engagements, the first step is always to setup a Windows Performance Monitor Data Collection, which I analyze after running it for several hours. This already gives you a very good idea of the areas on which you should further focus your troubleshooting efforts.
Summary
Today we had a more detailed look at how you can monitor your SQL Server installation for possible performance problems. The most important point here is the fact that you need to establish a baseline. With a baseline it’s very easy to determine if a given deployed change to your SQL Server installation was a good or bad one. Without an established baseline, you can only guess if a change has a positive effect, or not.

Subscribe to my channel
")
")
Free Microsoft Workshops
![]()
- Fabric Analyst
- Power BI dashboard
- Real-Time Intelligence