

Ever had that awesome SQL tracer build up that does just the right thing for your system to do some performance monitoring – well I know that I had. And someday you might need just the same trace again. But now you need to build it again…
Here comes the feature Extended Events in place. It was first introduced in the SQL 2008 version. The feature is a good and lightweight event-driven mechanism for collecting information about your SQL server. The Extended Events has a lighter footprint than the old Trace Events. It also has a more programmatic approach to get the events and information that they respond to. The Extended Events has another cool feature – they are stored inside the SQL server and can be turned on and off very simple – even on a job-vise level, rather than the old-fasion way to recreate and rethink the whole semantic for every trance you need.
Also the Trace Events is not guaranteed to exist on future versions of SQL server – so now is the time to learn it before you are forced to do it.
But but, it was all T-SQL-vise to use the feature – for me that was to many arguments and variables to know them by heart. The output from the collection was XML and therefore needed more decoding to be used for optimization. So I never got to use them on a daily basis.
And along came Polly the Extended Events GUI with SQL 2012.
Finally a GUI to the Extended Events handler that ease up your daily work with the SQL server. A set of GUI interfaces have been introduced for dealing with Extended Events: a Wizard, an Extended Events Properties Editor, and a Data Viewer. The Wizard is a handy way to get walked through creating an Extended Events Session, but I’m going to skip past that and talk about the Properties Editor and the Data Viewer. These two interfaces are where you’re going to spend most of your time.
You can find the Extended Events Sessions under the Management folder in SQL Server Management Studio (SSMS). As a replacement (and enhancement, because it does more) for the default trace, a Session comes installed, system_health. You can use this as a great way to learn how Extended Events Sessions are set up because the Session includes many different types of Events, Targets, Filters, and Actions. The same set of windows we’re about to go over can also be used to create new Sessions in addition to edit existing ones.
Defining a Session
For illustration purposes, I’m going to stop the system_health Session while we examine its properties, just so that they’re mostly accessible. All I have to do to make this happen is right-click the session and select Stop Session from the context menu. Right-click the Session again and select Properties, and the Editor opens.
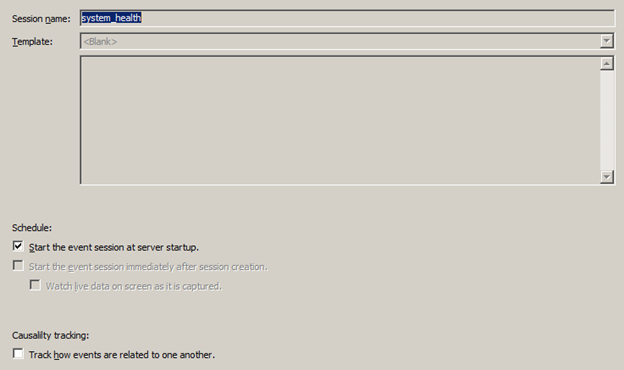
Even though there is details in the window, most of them are self-explainable.
It’s a matter of supplying a Session name and, when you are creating a new Session, you can pull from a list of Session Templates.
The nifty feature is that you have full control of when the Session starts. When I start from scratch, I normally start the event immediately and watches the LIVE DATA in the Data Viewer window (more to come on this later).
Selecting Events
The next page down is the Events page. Clicking it on the left you’ll see all the power and flexibility of Extended Events on display.
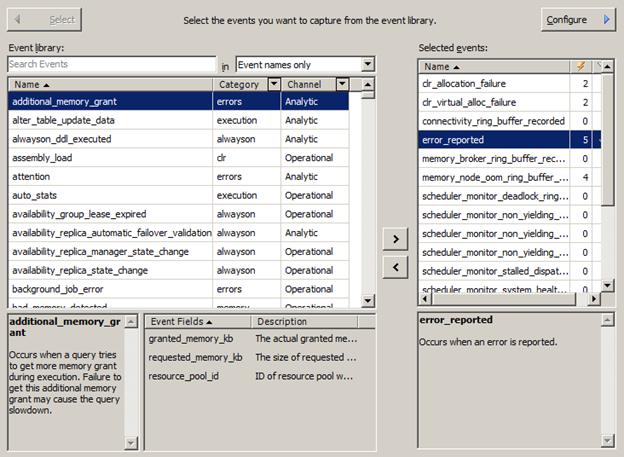
Yup, there’s a lot of things and corners here. Let’s take them one at a time. The left side of the screen is where the main work is done – at the top there is a text field and a drop-down selection box. This lets you search the collection of events in the system. For example, in the above screenshot there’s no search in place, so all events are displayed. If I typed something in the textbox, the events below the bo would the filtered according to my search. This is a great way to quickly find the specific event you might want to use. The drop-down feature can then help you on the way by selecting e.g. ‘Event names only’, ‘Event Fields only’, ‘Event names and Description’ or ‘All’.
On the list itself you can further filter the Extended Events you are interested in. The headings on the columns can be sortet just by clicking on them. On the above picture the Name is sorted (the little triangle to the right of ‘Name’ indicates the sorting order. The columns Category and Channel are drop-downs that let you filter the list even further.
The names of the Extended Events can be very cryptic. Therefore you’ll find additional description of the selected Event at the lower left corner of the window. Right next to this, there is a list with the fields for the selected Extended Event. These fields can be carefully compared to the old fashion Columns in the Tracer; they are somewhat more inherent and unique to each Event. When capturing and Event you also by default capture most of its Fields. More on these exceptions later.
Once you are satisfied with your selection of Event, you click the large right arrow in the center of the screen to move that Event to the Selected Events list. Removal of items from this list is easy-peasy. Again below this list, you’ll get a second description of the Extended Event you’ve selected.
Configuring Events
There’s even more functionality on this page. Notice that button in the top right corner that says Configure and points to the right? Click that and you get to a whole new set of functionality.
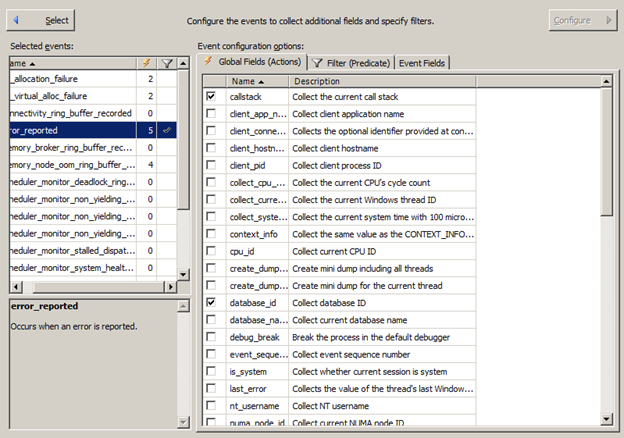
Here you configure the Events. If you want to go back – just click the Select button.
On the left side of the window you have a list of Events, and some extra goodies. First the name, and here you can, again, sort as you like. Below a description of the selected Event. Right next to the name column there is a column (the one with the lightning) showing how many Global Fields, also known as Actions, have been selected. The last column shows whether the Event is filtered. This is a great way to quick and easy identify the Filters and Actions you have. In the above picture, you can see that error_reported has a filter, and none of the other Events have.
To the right there are 3 tabs: Global Fields (Actions), Filter (Predicate) and Event Fields. The first one – an Action, a global fieldm or an additional column that you can add to any event that you want to capture. An example is the error_reported event that is currently highlighted does not have a database_id Event Field. If you want to capture that field when an error occurs (might be a good idea), you will have to use an Action.
The thing is, that an Action is captured after the Event and is executed synchronously. This means that if there is anything that might cause some performance bottlenecks as a part of your Extended Event capture, here is a likely candidate (among a few others). So instead of calling them Global Fields, which can sound a little to attractive, I would prefer the name i parentheses Actions. This way it is clear that they are different and that you should use them with caution. Selecting a particular Action’s check box adds it to the Extended Event selected on the left side of the screen.
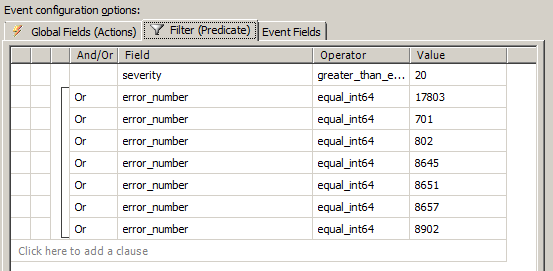
As shown above, clicking the Events (Predicate) tab lets you see and control which events gets captured. Also, obvious, you can add more lines in an easy-access manner. Each of the columns provides you with a drop-down list, except the final one where you’re expected to enter information. The Fields are from the event and a selection of operating system and SQL Server Fields that you can filter on. The comparison operators are the standard set of equals, less than, and so on, divided up into int and int64. The one thing I’d add is that the more immediate your first filter, the less load these will place on the system. Eliminating all errors below 20 as the first criteria is a good example.
The last tab shows the Event Fields, fields that are unique to this event. Don’t misunderstand me: events have lots of fields in common (such as session_id and database_id, because these are common values within SQL Server), but each event has a preselected list of Fields that apply to it.
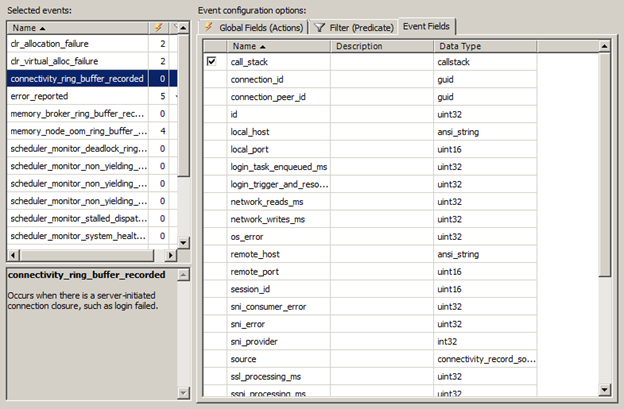
Mostly this is just a listing of the Fields and their data types for the selected Event. However, note the event at the top of the list with the check box. By default, all Fields are included, except a few that are more expensive to collect. You have to decide whether you need these Fields when you’re setting up your Extended Events Session. Selecting the check box will include them in the Session.
Data Storage
And that’s it. You’ve now seen how to select a list of Extended Events and to configure those events with Actions, Filters, and Event Fields. Up to now I haven’t talked about where all this information goes. That’s the next page. Clicking the Data Storage page on the left side of the screen via the page listing there opens up a screen like this:
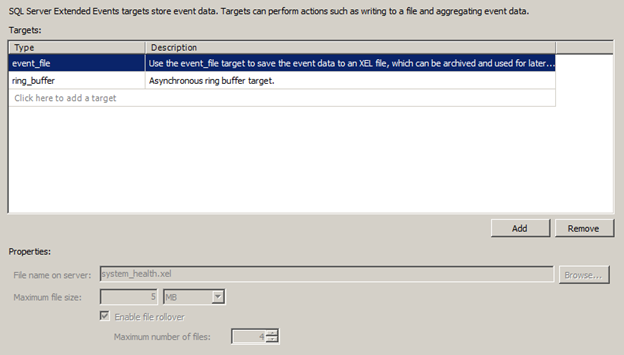
You can define a number of different Targets for your Extended Events Sessions. It really depends on how you’re trying to consume these events. The interesting thing is, if you just want to watch the Session live, you don’t actually have to designate a target here. I don’t want to try to describe what all these are for and what they can do; there’s better documentation for that.
But for most situations, the likely target will be the one selected, event_file. This puts all the output into a file. When you select this Target, you get several properties that you must define at the bottom of the screen. For example, the file name and location are naturally included. You also get to decide how large you want the files to be, if you want them to rollover as they’re filled, and, if they’re rolling over, what the maximum number of files ought to be. It’s a great way to capture information like query performance metrics so that you can later load them into tables and start running reports to identify the longest running query, for example.
Advanced features
The last page is the Advanced features
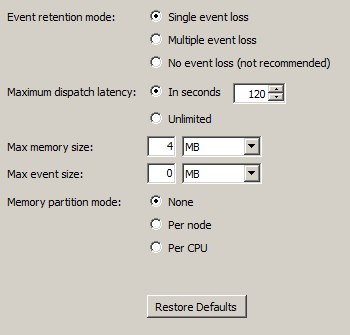
I’ll not go deep into this except to say that here there is a lot of control over how much impact you’ll allow, or force to your setup of Extended Events. By making adjustments here, you can ensure that you have no losses to Events (and probably a much higher load on your system) or a very lossy process (with a lower impact). Look to Books Online and other resources for when and how to adjust these.
That’s it! Done. Click OK, and now you have a new Session (or you’ve updated an existing one) No T-SQL required. However, it is still possible to script your own Session once its created to be used on other servers if applicable.
Time to watch SQL-telly
Now I can watch queries as they go by. All I have to do is right-click the Session and select Watch Live Data, and the Data Viewer window opens as in Figure 8. What’s more, you can use the File, Open, and find *.xel files and open them directly into the same viewer.
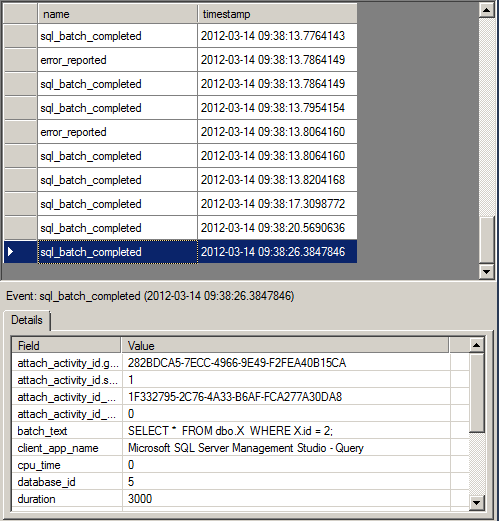
The window is split in two. At the top are all the events and the timestamp for when they occurred. At the bottom are the Fields for the selected Event in the window above. You can scroll through the various data, and you’ll see everything you need, no XML required.
Scrolling around to find the data you want can be a pain, so, if you like, you can right-click a Field in the lower window and select Show Column In Table from the context menu. Below a few columns displayed in the grid.
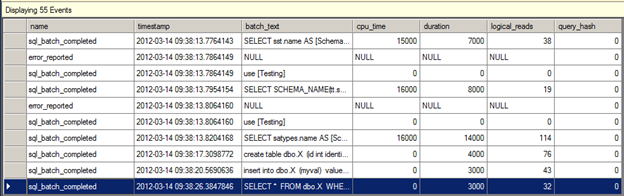
There’s a bunch more functionality built into the Data Viewer. You can double-click a Field to open in a new window, which is handy for viewing long T-SQL strings or XML output. If you’re looking at either a stopped Session or a file, you can sort the grid by columns. You can’t do that while watching Live data. Best of all, and I really love this, you can toggle a bookmark on an event so that you can find your way back to that event quickly. OK, maybe that isn’t best, but it’s pretty good. You can also apply a filter based on a value in a Field to show only that one. So, for example, if I only wanted to look at the error_reported Events from above example, I could right-click that column where that is the value and select Filter On This Value from the context menu.

If you’re looking at a Session, not a file, you can start and stop the session, pick which window you want shown, edit your filters, and do grouping and aggregation. Actually that’s pretty slick, too. What I’ve done in Figure 11 is group by the Event name Field so that I’m seeing all of a particular event as a set.
From my small run of events I have three different types: error_reported with 18 Events, rpc_completed with 4, and sql_batch_completd with 41. I’ve expanded the rpc_completed to show the individual calls. This does bring out one issue with Extended Events that I found to be a little problematic for gathering query metrics. Note that the batch_text Field is NULL for all the rpc_completed events. This is because the rpc_completed Event has a statement Field that is the equivalent to the batch_text field in the sql_batch_completed Event. A slight pain, and something to be aware of. However, you’re compensated by being able to get the object_name Field, which means you can immediately group all your stored procedure calls by the name of the procedure, no worries about trying to parse out the T-SQL information to remove parameters. That’s a huge win.
A little extra feature is the ability search in the results as shown below.
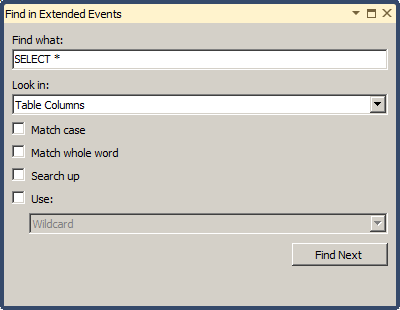
You can define what field or fields you want to search through. In my case, I chose Table Columns. You can put different criteria in and even make use of wildcards and regular expressions. I left that off in my case so that I could find the literal string ‘SELECT *’.
There’s still more that I haven’t covered, but you get the idea. With SQL Server 2012 you get the ability to do fully fledged data exploration through your Extended Event output.
Summary of performance monitoring

Subscribe to my channel
")
")
Free Microsoft Workshops
![]()
- Fabric Analyst
- Power BI dashboard
- Real-Time Intelligence