

Along with the release of SQL server 2016 CTP 3 now comes the preview of a brand new feature for on premise databases – the Query Store. This feature enables performance monitoring and troubleshooting through the log of executed queries.
This blogpost will cover the following aspects of the Query Store feature:
- Introduction
- How to activate it
- Configuration options
- What information is found in the Query Store
- How to use the feature
- What’s in it for me
Introduction
The new feature Query Store enables everyone with responsibility for SQL server performance and troubleshooting with insight to the actual queries and their query-plans. It simplifies the old way of setting up tracing, logging and event handling to a standard, out of the box, feature.
It enables you to find causes for performance differences due to a change in query plans. It also captures historic data from queries, plans, statistics (runtime), and keeps these for later review. This storage is divided into configured time-slots.
All in all, this feature enables you to monitor, capture and analyze performance issues in the server with a few standard settings.
How to activate it
The feature can be enabled in to ways – from SSMS with mouse-clicks or from T-SQL statements.
Enable Query Store from Management Studio
From the Object Explorer pane, right-click the database and select the Properties option.
Click the Query Store tab and change the
‘Enable’ to TRUE: 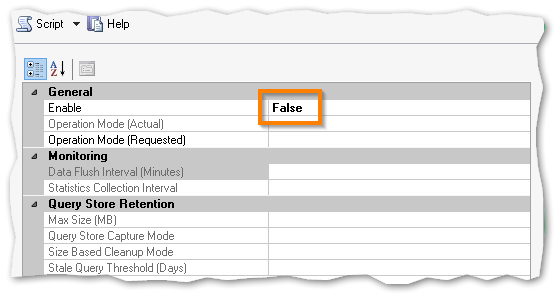
Enable Query Store from T-SQL statement
In a new query window, the following statement enables the Query Store feature on the database ‘QueryStoreDB’:
|
|
Configuration options
The Query Store has a series of configuration options. All of them can be set from SQL Server Management Studio through th GUI or using T-SQL statements.
OPERATION_MODE – This can be READ_WRITE or READ_ONLY and states if the Query Store is to collect new data (READ_WRITE) or not to collect data and just hold current data (READ_ONLY).
CLEANUP_POLICY – Specifies through the STALE_QUERY_THRESHOLD_DAYS the number of days for the query store to retain data.
DATA_FLUSH_INTERVAL_SECONDS – Gives the interval in which the data written to the Query Store is persisted to the disk. The frequency, which is asynchronous, for which the transfer occurs is configured via DATA_FLUSH_INTERVAL_SECONDS.
MAX_STORAGE_SIZE_MB – This gives the maximum size of the total data in the Query Store. If and when the limit is reached, the OPERATION_MODE is automatic changed to READ_ONLY and no more data is collected.
INTERVAL_LENGTH_MINUTES – Gives the interval at which the data from runtime execution stats is aggregated. The option gives the fixed time window for this aggregation.
SIZE_BASED_CLEANUP_MODE – When the data in the Query Store gets close to the configured number in MAX_STORAGE_SIZE_MB this option can control the automatic cleanup process.
QUERY_CAPTURE_MODE – Gives the Query Store option to capture all queries or relevant queries based on execution count and resource usage.
MAX_PLANS_PER_QUERY – The maximum number of execution plans maintained for queries.
From SQL Server Management Studio, the window look like below
when the Query Store is enabled. Also in the bottom of this window,
you can see the current disk usage: 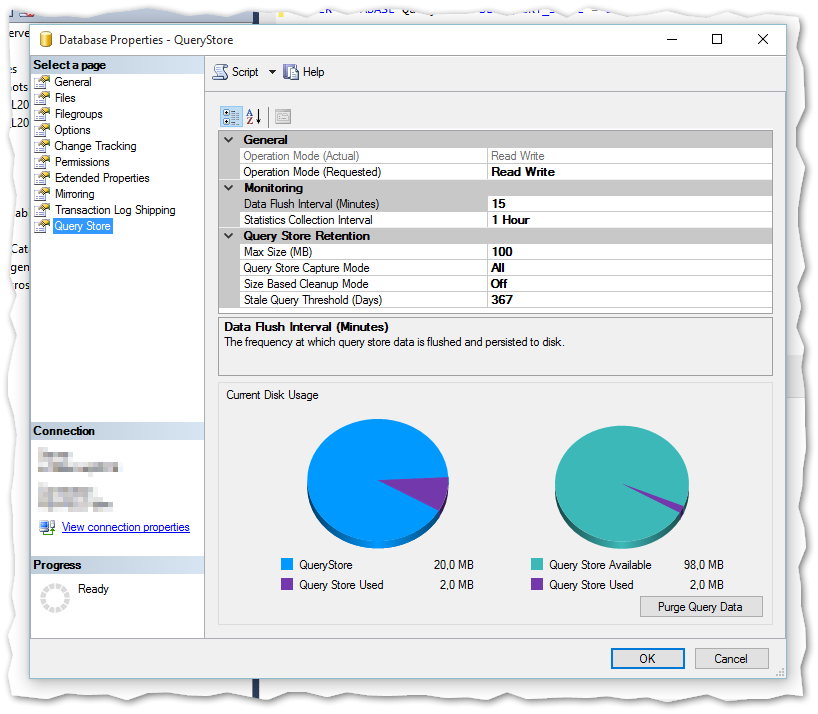
The T-SQL syntax for setting the Query Store options is as follows:
|
|
What information can be found in the Query Store
Specific queries in the SQL server normally has evolving execution plans over time. Thisis due to e.g. schema changes, changes in statistics, indexes etc. Also the plan cache evicts execution plans due to a memory pressure. The result is that the query performance troubleshooting can be non-trivial and time consuming to resolve.
The Query Store retains multiple execution plans per query. Therefore, it can be used to enforce certain execution plans to specific queries. This is called plan forcing (see below for stored procedure to do this).
Prior to SQL 2016 the hint ‘USE PLAN’ was used, but now it is a fairly easy task to enforce a specific execution plan to the query processor.
More scenarios for using the Query Store:
- Find and fix queries that have a regression in performance due to plan changes
- Overview of how often and in which context a query has been executed, helping the DBA on performance tuning tasks
- Overview of the historic plan changes for a given query
- Identity top n queries (by time, CPU time, IO, etc.) in the past x hours
- Analyze the use of resources (IO, CPU and memory)
The Query Store contains two stores – a plan store and a runtime stats store. The Plan Store persists the execution plan information and the Runtime Stats Store persists the execution statistics information. Information is written to the two stores asynchronously to optimize performance.
The space used to hold the runtime execution information can grow over time, so the data is aggregated over a fixed time window as per setting made in the configuration.
When the Query Store feature is enabled in the database, a set of system views will be ready for queries.
sys.database_query_store_options sys.query_context_settings sys.query_store_query sys.query_store_query_text sys.query_store_plan sys.query_store_runtime_stats sys.query_store_runtime_stats_interval
Furthermore, a series of system stored procedures can be called:
sp_query_store_flush_db sp_query_store_reset_exec_stats sp_query_store_force_plan sp_query_store_unforce_plan sp_query_store_remove_plan sp_query_store_remove_query
How to use Query Store
The Query Store comes with 4 standard reports as shown below:
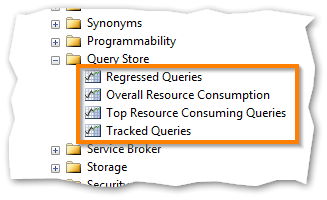
All standard reports can be modified in several ways to fit your personal needs. This is done by selection in drop-downs and point-and-click.
The Regressed Queries gives an overview of the
top 25 most resource consuming queries in the last hour. This
includes the execution plan, a time table to see when and for how
long the query took to run etc.: 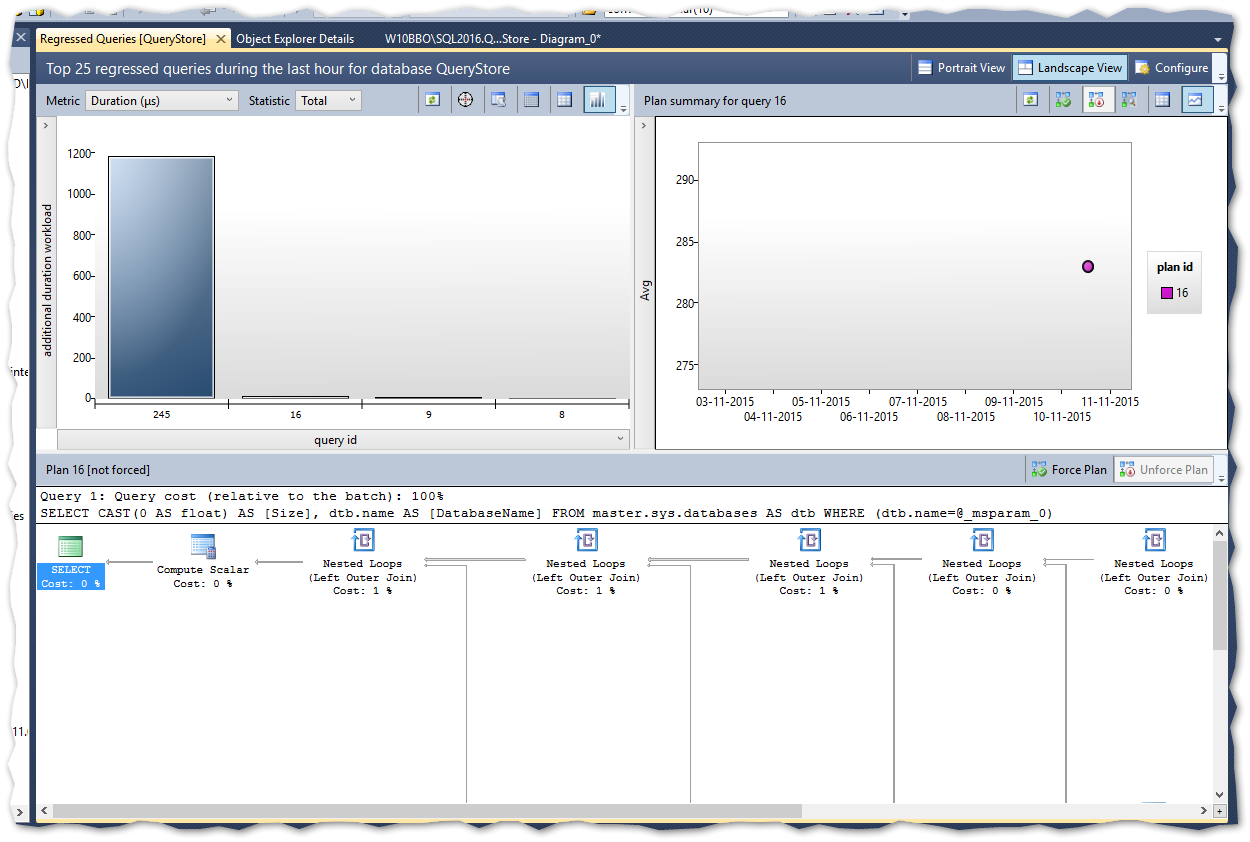
The Overall Resource Consumption shows 4 charts
as standard based on duration, execution count, CPU time and
Logical reads: 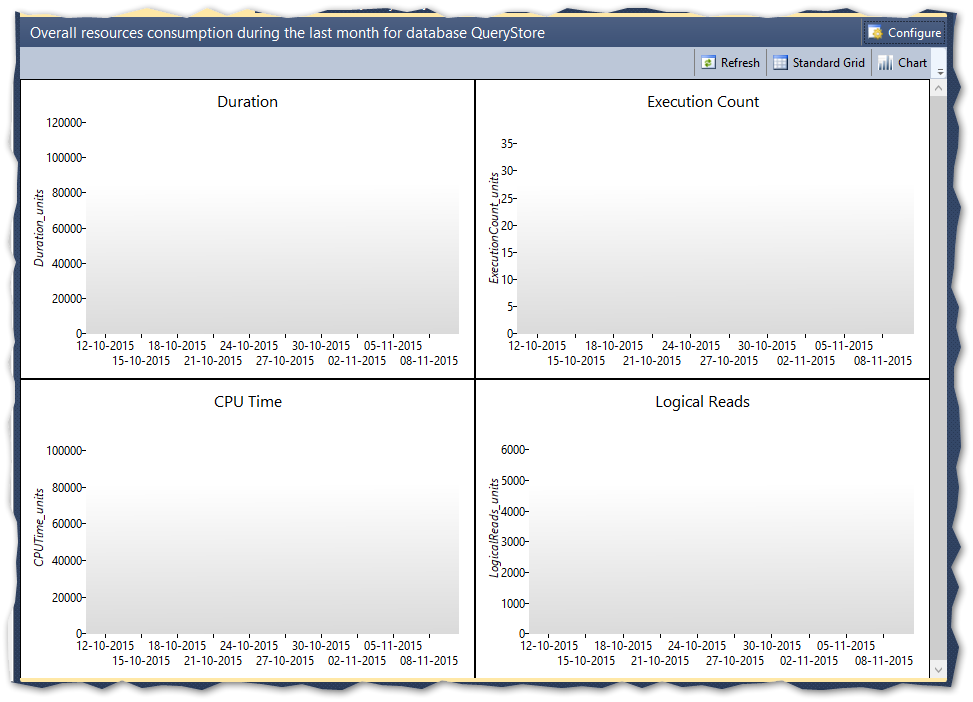
The Top Resource Consuming Queries report shows in the same format as Regressed Queries only non-aggregated and with more details.
The Tracked Queries report shows detailed data from the selected query – here you need to find and remember the query id – this can be found, among other ways, from below queries against the Query Store system views.
The data from the Query Store can be accessed from the above described system views. Examples of usage can be found below.
Top 5 queries with the longest average execution time the last hour
|
|
Last 10 queries executed on the server
|
|
Queries with more than one execution plan
|
|
Source: Monitoring Performance By Using the Query Store
What’s in it for me
Well, I hope that the answer to this is pretty obvious to you after reading this post 🙂
The Query Store feature enables any person responsible for database performance to monitor, analyze and keep track of queries, execution plans and resource usage through system views or standard reports from within SQL Server Management Studio.
Conclusion
This new feature is a great add-on for the DBA (or accidental DBA) that needs to keep the analytical data in a standard form, and have an availability of query statistics and troubleshooting.
This blogpost is based on the latest CTP of SQL Server 2016 (CTP 3.0) which can be downloaded here: SQL Server Evaluations

Subscribe to my channel
")
")
Free Microsoft Workshops
![]()
- Fabric Analyst
- Power BI dashboard
- Real-Time Intelligence