// Learn Kusto - Week 6

This week it is almost Easter and time for cozy and relaxing time with the family. Relaxing time is also a part of this post, as I will show you some of the different meta-data options you have in Kusto and what to do with them.
The main meta data part in Kusto
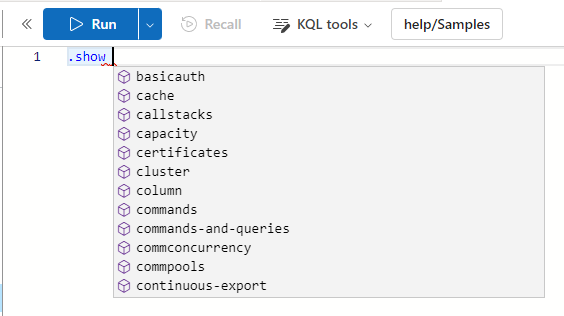
In Kusto and the services Azure Data Explorer and Synapse Data Explorer, there is one main part of the meta data queries - the .show command. The .show command preceeds the rest of the following commands for exploring the meta data in the engine:
- queries
- commands
- commands-and-queries
- journal
- operations
- ingestion failures
- table data statistics
All of the above commands needs the .show command first - the reason for this, is that the intellisense in the service helps you to remember the 7 commands as long as you can remember the first one:
In order to access these command you need to either be a Database Admin or Database Monitor on the cluster.
.show queries
This command displays information about the current running queries a long with those which are done. The resultset contains a lot of information - among this the duration, the information of who the user is, how much memory each single query is using and from where the query is executed (web, application etc.).
This command also has an abreviation containing “running” - you put this between .show and queries and get only the current running queries.
You can also filter the context of the resultset with an optional parameter [by user <UPN>]:
*.show running queries [by user \<UPN>]*
.show commands
As with the queries command this gives a resultset based on command that has reached the final stage of “completed”. Not every command that is executed towards the engine reaches this stage. The information will be stored for 30 days.
.show commands-and-queries
This is a collection of the two former queries in one single command with all you need to know about the commands and queries. As it is “joined” with the commands part, this data is also only available in 30 days.
.show journal
This command shows all meta data operations done on the database. This command is the only one that every user has access to query. The command shows metadata changes in the cluster - this could be create table or rename table.
The command has, as with the queries, an extra feature - you can add database and <database name> to the journal command like this:
.show database <database name> journal
This wil then filter the journal to a specific database and return the resultset based on this - please note that you need access to the specific database to be able to access this.
.show operations
This returns a list of administrative operations - both currently running and already completed operations. An administrative operation could be ex. a new access policy or a new function. If a user (non admin) executes this command, then the resultset will only contain the specific user’s administrative operations.
Data is kept for 2 weeks to query.
An additional option is to add details to the end of the command, to get even more details of each operation.
.show ingestion failures
This command is perhaps self-explanatory - it returns the failues for ingestion operations in the current database.
.show table data statistics
This is my favorite command. It shows the current state of storage and columns for tables (or a specific table). The returned data is quite awesome - it shows the current compressio of data from raw data to the Kusto engine - here from the demo cluster named HELP on the table RawSysLogs:
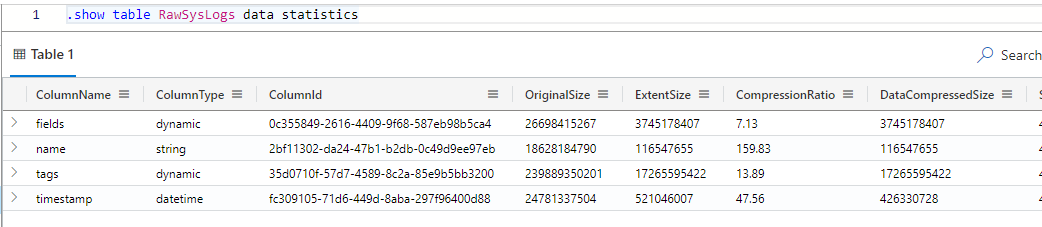
Above picture illustrates some of the power of Kusto - look at the name row and the CompressionRatio column. A compression rate of 159.83 is awesome.
The number is the to other columns OriginalSize and DataCompressedSize ratio:
18,628,184,790 / 116,547,655 = 159.83
In other words for every 1 byte saved in the cluster there exists around 160 bytes of data for that specific column. The other columns in the table are hard to compress, as they consists of integers and json (timestamp is also stored as integer in the engine).
An example usage of the .show queries
Below query is borrowed from Microsoft from an online session with Dany Hoter
An example usage of the above command can be below query. It shows the current and past executions and queries along with their consumption in the cluster.
.show commands-and-queries
// | where ClientActivityId startswith "KPBI"
| where StartedOn > datetime(2022-12-04T09:04:51.198128Z)
| where User ==current_principal_details().UserPrincipalName
| order by StartedOn asc
| extend delay=datetime_diff("Millisecond",next(StartedOn),LastUpdatedOn)
| extend delay=iff(delay<0 or delay> 5000,0,delay)
| extend MB=format_bytes(MemoryPeak)
| extend Isgetschema=Text has "getschema"
| extend IsPreview=Text has "limit 1000 "
| extend Len=strlen(Text)
| extend TextLength=strlen(Text)
| extend ScannedData=format_bytes(tolong(CacheStatistics.Shards.Hot.HitBytes))
| fork
  Queries=(where CommandType =="Query" and  Isgetschema==false and IsPreview ==false |  project StartedOn,  LastUpdatedOn,  Duration, TotalCpu, ScannedData,  MB,Text | order by StartedOn asc)
  Commands=(where CommandType =="AdminThenQuery" |  project StartedOn,LastUpdatedOn, Duration, TotalCpu, MB, ScannedData ,Text | order by StartedOn asc)
  Detail=(project StartedOn,State,FailureReason, Duration, delay, TotalCpu,Isgetschema, MB, ScannedData,ClientActivityId, Text | order by StartedOn asc)
  Slow=(where CommandType =="Query" | project Duration, TotalCpu, MB, ScannedData,Text | order by Duration)
  Getschema=(where CommandType =="Query" and  Isgetschema==true |  project StartedOn,Text)
  Summary=(summarize Commands=countif(CommandType =="AdminThenQuery"),Queries=countif(CommandType=="Query"),DelayCommand=sumif(delay, CommandType =="AdminThenQuery"),
    DelayQuery=sumif(delay, CommandType =="Query"),mn=min(StartedOn),mx=max( LastUpdatedOn),TotCPU=sum(TotalCpu),TotDuration=sum(Duration)
     | extend OveralDuration=(mx-mn))
References used in this post
☕