// Learn Kusto - Week 2

Last week I tried to lay the foundation to understand the engine that supports and drives the Kusto language and the Azure Data Explorer. We learned that the engine is using Shards as a primary storage method and how the engine handles the queries and executes them.
This week we’ll start at the beginning of the Kusto language and do some basic data discovery.
The setup and demo data
For you to be able to follow along, you have to set up your own Kusto demo environment. you can do this by following this link. The link redirects you to the Azure Data Explorer (you need to log in with a Microsoft account, either work or private). After the setup has completed, you’ll be presented with a short guide through the UI and interface.
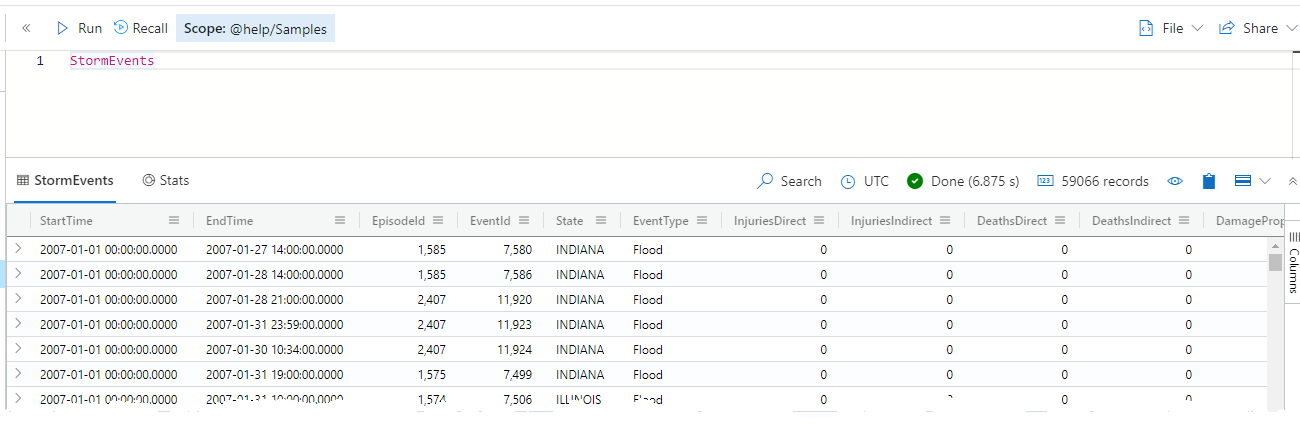
After the setup and the guide you should have a window like the one below:
The UI you are seing is the Azure Data Explorer and is the primary go-to service for working with the Kusto universe. There is other ways of working with data in the Kusto way - I’ll cover these in a later week. For now I’ll use the UI from Azure Data Explorer (in short ADX).
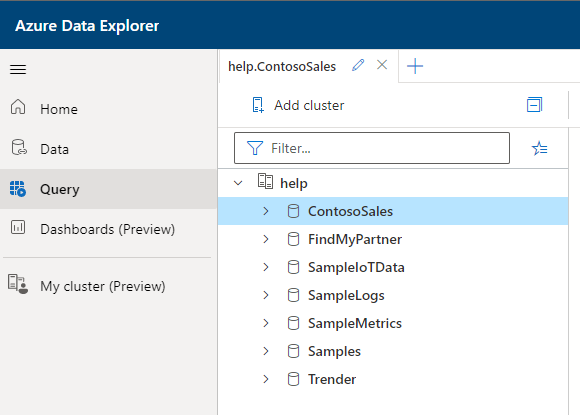
The UI guide does now show you everything - a special thing I would like to show you is the “My Cluster” area from the UI.
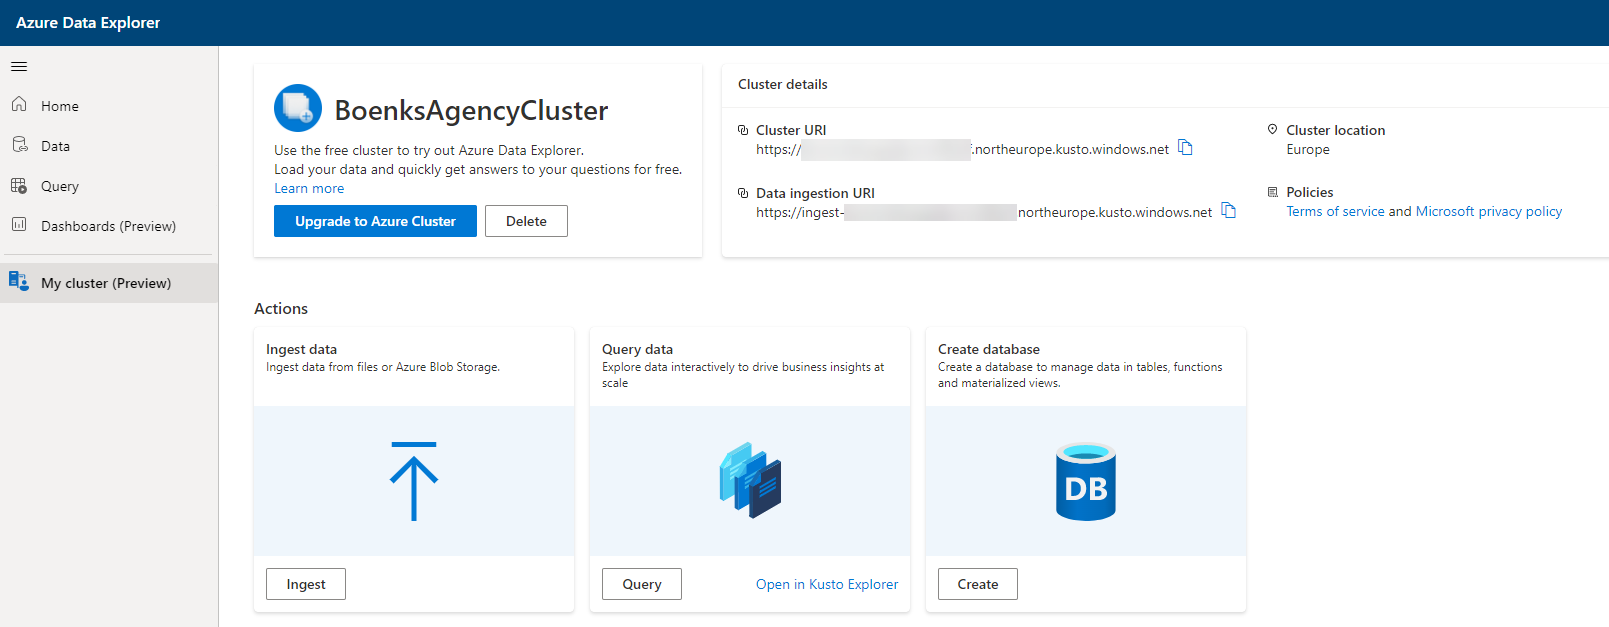
The UI here shows you the cluster details - you’ll need them when we hit the week to go through the Kusto Agency playground from Microsoft. In here you can also ingest new data directly to your cluster and handle other things like creating a database, upgrade your cluster to have more compute (you don’t need that for this entire journey).
Your first data selection
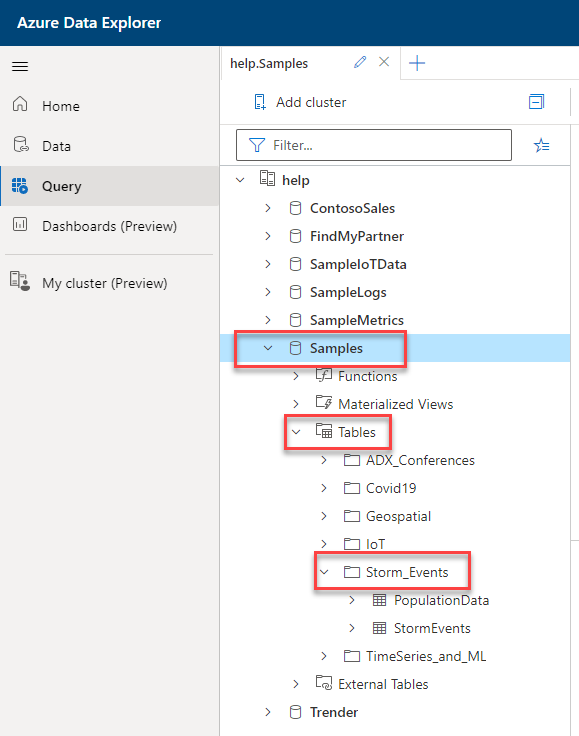
Given the above proces, we can now drill down to a specific table from the demo data - I’ll use the Storm_Events table.
Directly in the UI to the right - start typing the table name “StormEvents”. You’ll notice that you have full intellisense to help you with your typing and coding.
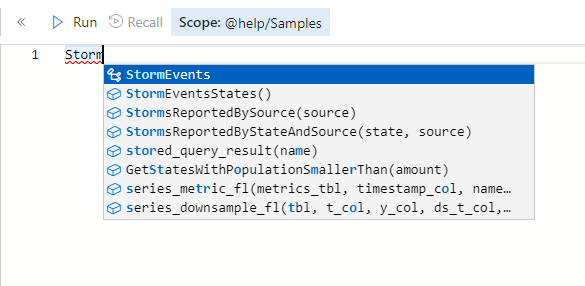
Please note that you have to mark/select the “Samples” database to get the full intellisense from the UI
Without futher typing (no line break) press the “Run” button. You’ll now query the table for StormEvents from the database Samples. In about 6-7 seconds the data will be displayed below the query window as below example.
If you come from the T-SQL language you’ll be used to write “SELECT .. FROM”. In Kusto, from my point of view, the language is much more similar to a spoken language and from this, perhaps, a bit more easy to learn.
For the geeks and those who are interested in the engines performance and whereabouts, you can find a “Stats” button right next to your “StormEvents” button in the top bar just above the resultset.
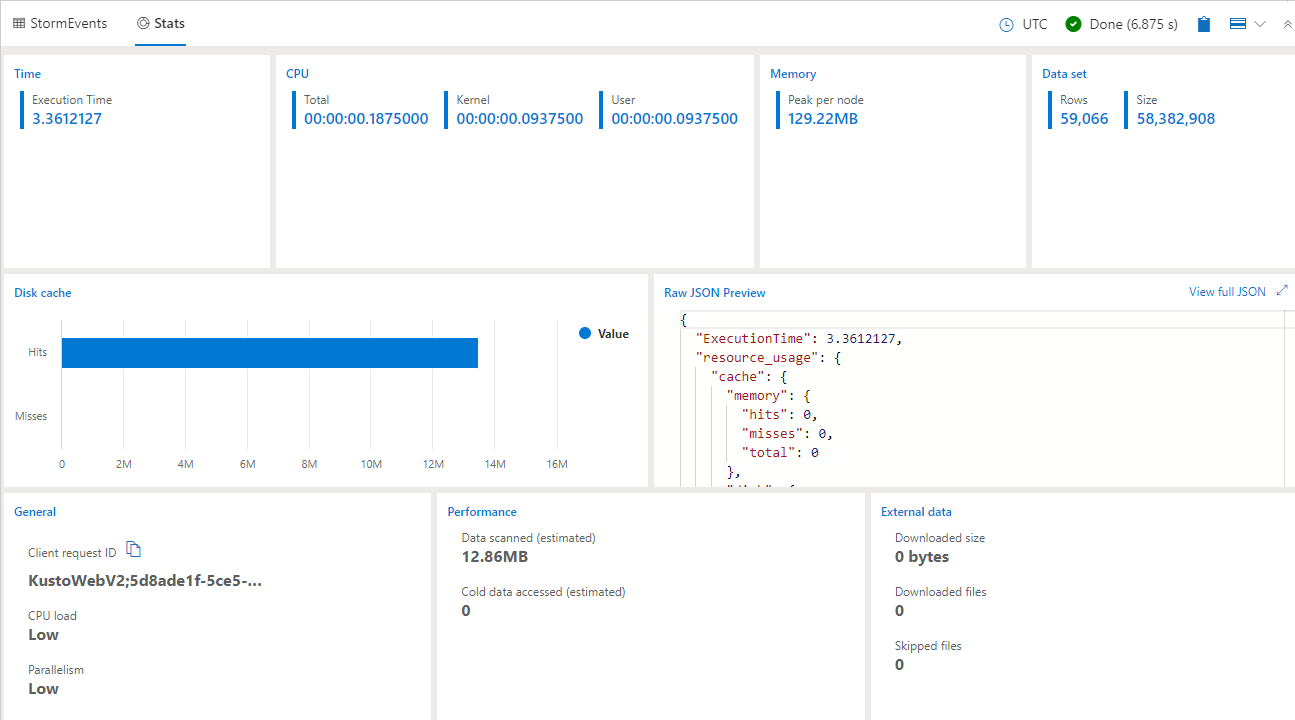
The above picture is showing you, among other things, the amount of time the query has used and the memory, dataset and disk cache. It is a good time spend if you browse around in this area - it will help you alot to be familiar when we hit the more advanced features of the Kusto universe.
You will also notice that the engine only used around 3 seconds to query the data - the UI in the front gave us 6-7 seconds. The time from 3 seconds to 6 seconds is used by the UI to present the data on the screen.
Filters and groupings
With the data displayed and the UI investigated we are ready to move to filtering and grouping
Every “task” in the Kusto language is devided by a pipe “|” - either on a new line or in one long line of code - for ease of read, I highly recommmend to make a new line for every new pipe in the script. This is also the default behavior when you use the intellisense from the UI, when you hit tab on a table, you get a new line with a pipe at the start.
Now write the below query and hit the Run button.
StormEvents
| where State == "INDIANA"
Data is now showing with only data from the State of Indiana. Please notice that the equal is done by two “=="-signs (compared to the T-SQL language of using only one).
Groupings are done in the same way as filtering. Below I’m using a sum to show you the grouping behavior and syntax. You can choose to name your new field with the syntax: «columnname» = «expression».
And if you like, you can add more than 1 new expression for the grouping (ex: Min, Max, Avg, Stdev etc). You can find all aggregrations to use in Kusto right here.
StormEvents
| summarize SumOfDeathsIndirect = sum(DeathsIndirect) by State, EventType
The groupings are done with the start of the line to use the “summarize” function, give the expression to solve and then give the column(s) to group by. In above example both State and EventType are used.
Summary
With this week 2 done, I’ve showed you the UI behind Azure Data Explorer and given you the entry knowledge to select data, filter it and make some simple aggregations based on an expression.
The above filter and group can ofcourse be used together to form a filtered group of data. This could be a small “you do it yourself” task until next week. Here we’ll start with joins and look into how we can do that in a good manner and help the engine to get good and fast results.
Don’t forget to sign up for news in this series of blogs using the form below.
☕