
Kusto in Fabric, With a bit of Magic
With the release of Microsoft Fabric, we also got the ability to use the Kusto engine in the platform. Not only can we now use our Kusto database and all the great stuff from the KQL language - we can also store KQL querysets and use those on our reporting platform.
The new magic
All of the above abilities are great additions to the Fabric service. But whats even more exciting is the new magic in Jupyter Notebooks. Yes, you read it right - we can now write KQL language in our Notebooks with the use of the new magic command "%kql".
Load the new extension to your notebooks
In order to use the kql magic in Notebooks, you need to import adn extension to your Notebooks. The kqlmagic extension gives you the ability to write KQL query code against your KQL database - in both Fabric and your ADX/SDX cluster.
Run the following code to import and reload your libraries:
Import kqlmagic to notebooks
|
|
Reload the extension
|
|
Use KQL expressions in your Notebooks
After the import of the extension you are ready to connect to your Kusto cluster or database write KQL code against your data.
To connect to the Microsoft HELP cluster (the free cluter for all to play around with), you can use below snippet.
|
|
NOTE the “-try_azcli_login” option is the flag type to try to login using your current credentials from the Azure portal. If that does not work, you will be prompted with a normal MFA login screen.
The complete list of login option flags are found here: Login flag options.
After the login to the HELP cluster, you can now write KQL queries in Notebooks as you would any other SQL, .NET, Python, R or Scala in Notebooks.
Example KQL code:
|
|
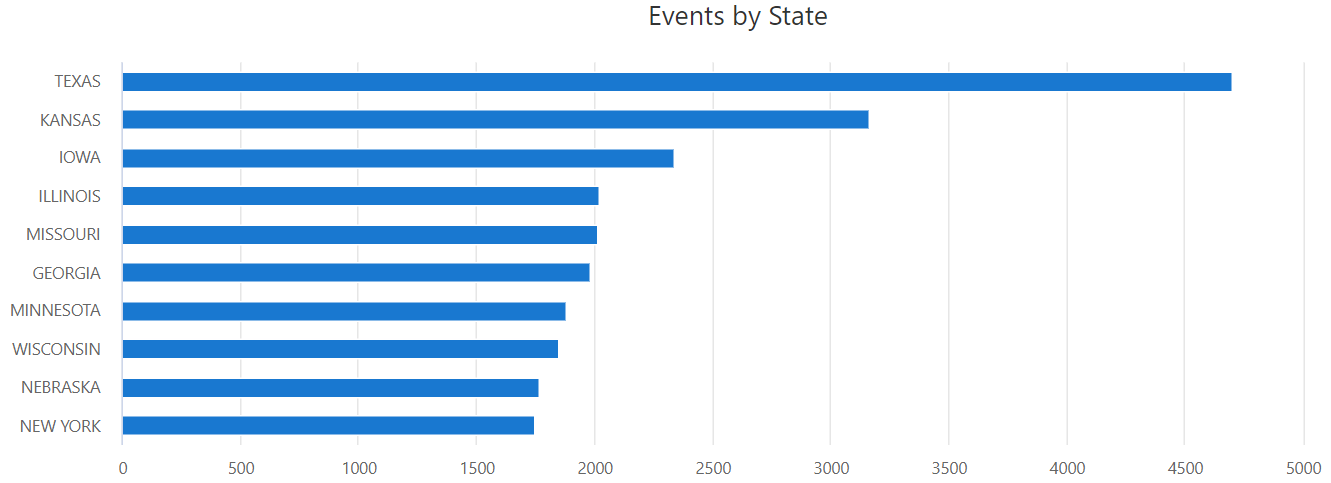
Above KQL query reads data from the StormEvents table in the HELP cluster, takes the first 10 rows from a count of events grouped by state. Lastly it renders the data as a barchart with the title “Events by state” as seen below.
Take off from here
What about the result set from a KQL query you might ask? Well - thats a part of the coming posts, so stay tuned and read more about this in one of the next posts on this blog.
You can sign up at the bottom of the page “Get Notified of new posts”.
Until then, have fun with your KQL magic.
Read more about the KQL magic in Notebooks from the Microsoft documentation right here: KQL magic
Subscribe to my channel
")
")
Free Microsoft Workshops
![]()
- Fabric Analyst
- Power BI dashboard
- Real-Time Intelligence