
With the release of SQL Server 2016 also comes a great new feature to get a live view of the current execution plan for an active query.
This blogpost will cover the aspects of this new feature including:
- Introduction
- How to activate
- How to use and read the output
- Downsides – if any
Introduction
The introduction of live query plans are in the current release of SQL Server 2016 CTP 2.2 a new feature from Microsoft, which hopefully will be in the final release.
The feature provides real-time insights to the SQL Server engine’s query execution process. This in a visual matter when data flows from one plan operator to the next in the execution. The display will cover the usual elements of an execution plan – this including the number of rows handled, the time spend, progress of the single operators and other well-known statistics of a query execution.
One of the good news in this feature is the ability to show and analyze the query even before it has finished. This is good when debugging complex queries – the operators are shown with their individual performance, giving the DBA or other persons responsible for the database a faster view of the places to make the performance optimization.
Activation
In SQL Server Management Studio, there is a new option when right clicking the query window – “Include Live Query Statistics”:
For some reason, there is no keyboard shortcut to activate that functionality. Maybe this will come in the RTM release of SSMS for SQL Server 2016.
This function can also be activated from the top-menu in SSMS
2016 CTP 2.2: 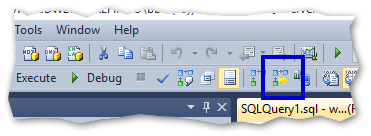
Note: this feature also works on SQL Server 2014 SP1 – as the feature relies on underlying DMV’s from this service pack.
If the session running the query has enabled either statistics XML (SET STATISTICS XML ON;) or statistics profile (SET STATISTICS PROFILE ON;) then the Live Query Statistics can also be reached from the activity monitor.
The DBA can also activate a server wide setting to enable Live Query Statistics on all sessions with the extended event query_post_execution_showplan – for more info click here
Right click the current query in Active Expensive Queries and
choose ‘Show Live Execution Plan’: 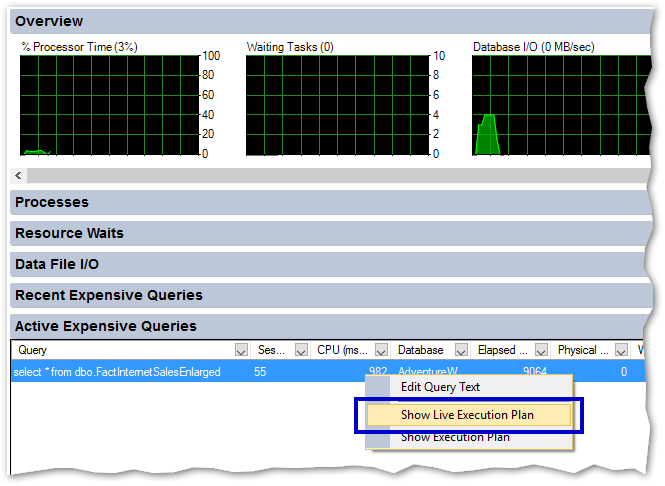
The observant reader will now ask – why are the names not the same across the SSMS? Well – I don’t know actually.
Security
A database level SHOWPLAN is required to populate the Live Query Statistics and the server level VIEW SERVER STATE permission in order to see the live statistics.
And voila! 
The query runs against an enlarged table from the AdventureWorksDW2012 with more than six mill. rows.
…and with a bit more complex query (not optimal query design at all):
The output
The output from the Live Query Statistics can be read like any
other execution plan. The operators are the same and the depper
statistics can be revealed like usual with hovering the cursor on
the single operators: 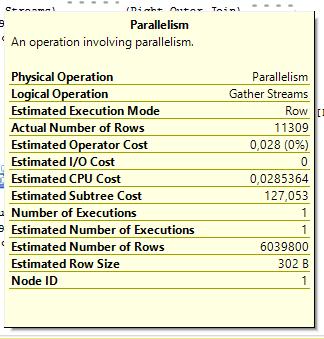
The data in these statistics will not change as the query runs – you have to move the cursor and hover again to get an updated info on the specific operators.
The DMV used is sys.dm_exec_query_profiles which can be queried and gives the same results in text-form as the graphic animations. But it is a lot more efficient and easier to decode the animations than the text-based results.
The catch
What great new feature – and it also works on SQL Server 2014 SP1 as mentioned earlier. But there is a catch – as always:
- If the query are using columnstore indexes then the live window will not show
- If the query are using tables that are memory optimized then the live window will not show
- NSP (Natively Stored Procedures) are not supported
It only works on SQL Server 2014 SP 1 and onwards. But who isn’t using one of those in production now .
Conclusion
The new feature Live Query Statistics are great for performance tuning of queries and the DBA that want to see the live performance of data loading in the database. The feature works like a charm and is, from my perspective, a nice feature.
I hope this post makes a great start for you to work with the Live Query Statistics. This post is written based on the current CTP of SQL Server 2016 (CTP 2.2) which can be downloaded here.

Subscribe to my channel
")
")
Free Microsoft Workshops
![]()
- Fabric Analyst
- Power BI dashboard
- Real-Time Intelligence